KS3 Science Skills Programme: Graphs and Tables
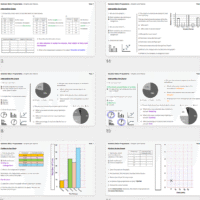
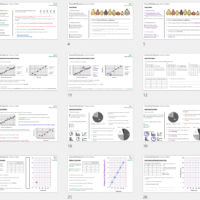
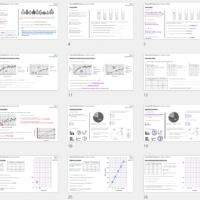
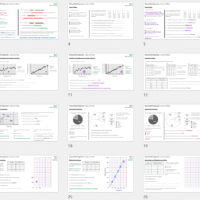
The KS3 Science Skills Programme: Graphs and Tables help students refresh and practice essential scientific skills with a series of thirteen short activities. Each activity includes self-assessment slides, so students can monitor their own progress and understanding.
You can embed these flexible activities within lessons or set them as homework. They offer an effective way for teachers to show their commitment to developing students’ fluency in science and enhancing subject-specific literacy.
Graphs and Tables tasks
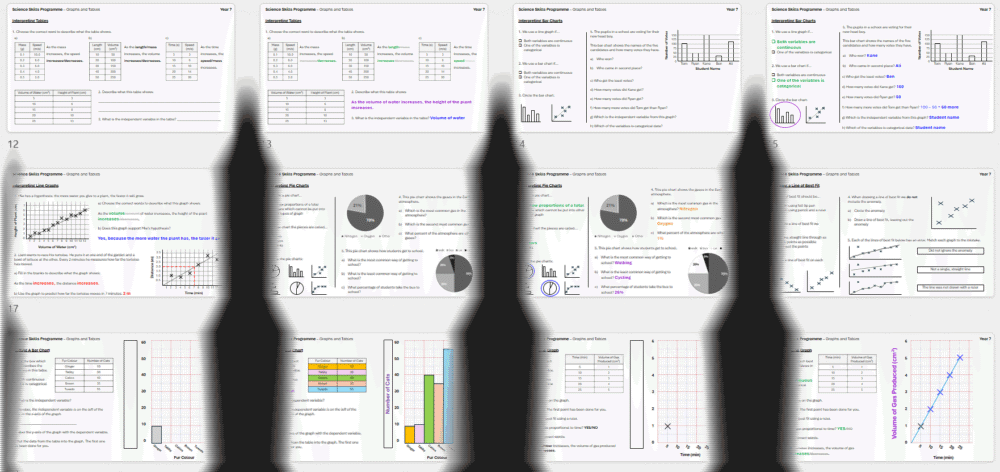
- Variables
- Types of data
- Line graphs and bar charts
- Identifying variables and anomalies in tables
- Identifying variables and anomalies in graphs
- Interpreting tables
- Interpreting bar charts
- Interpreting line graphs
- Interpreting pie charts
- Drawing a line of best fit
- Plotting a bar chart
- Plotting a line graph
- Summary task
Programme Features
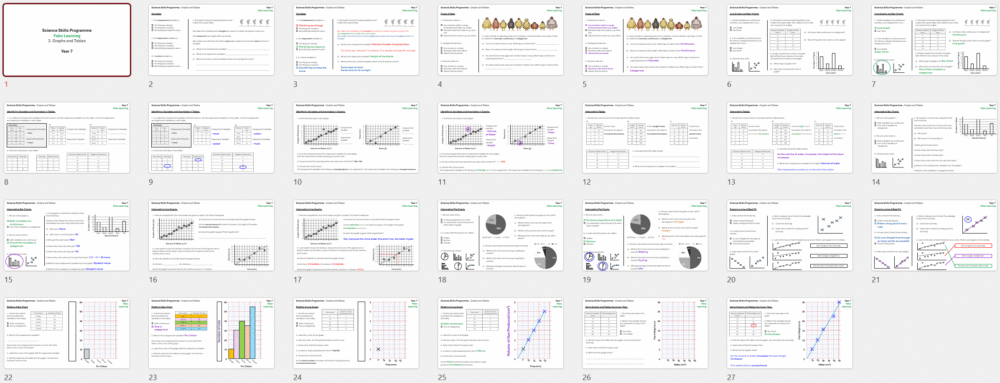
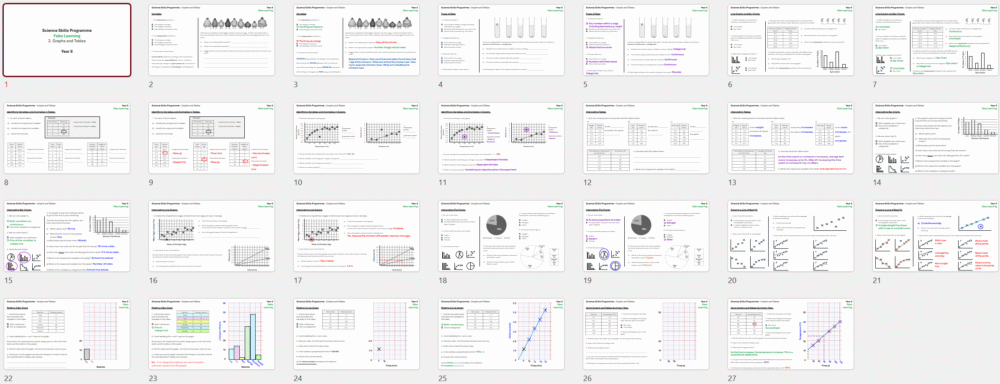
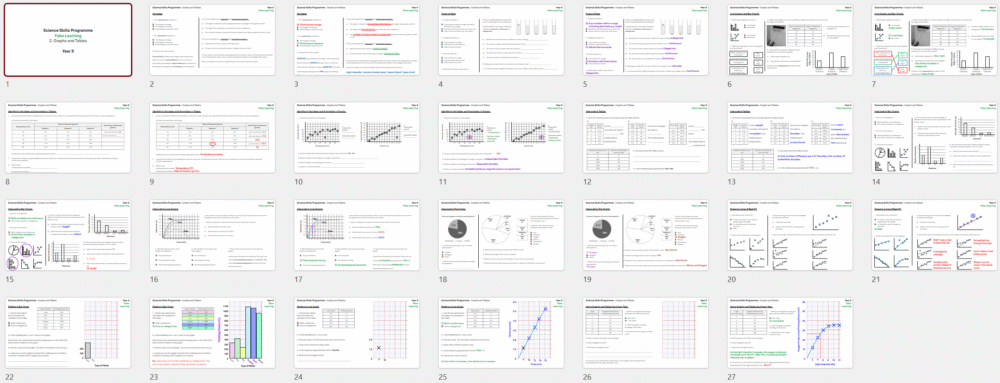
• Three differentiated versions of the activity sheets tailored for Years 7, 8, and 9
• All components of the sheets are fully editable, allowing teachers to adapt materials to suit their classes
• Resources can be printed in grey scale, making them cost-effective and accessible
• Answer slides are provided to support student self-assessment and reinforce learning
Get more from our science skills programme:
© febolearning All rights reserved. Editing is permitted for personal use only. This material may not be sold or redistributed as a whole, in part or in edited form without written permission.
In all cases this notice must remain intact. This notice applies to all usages, including educational.


